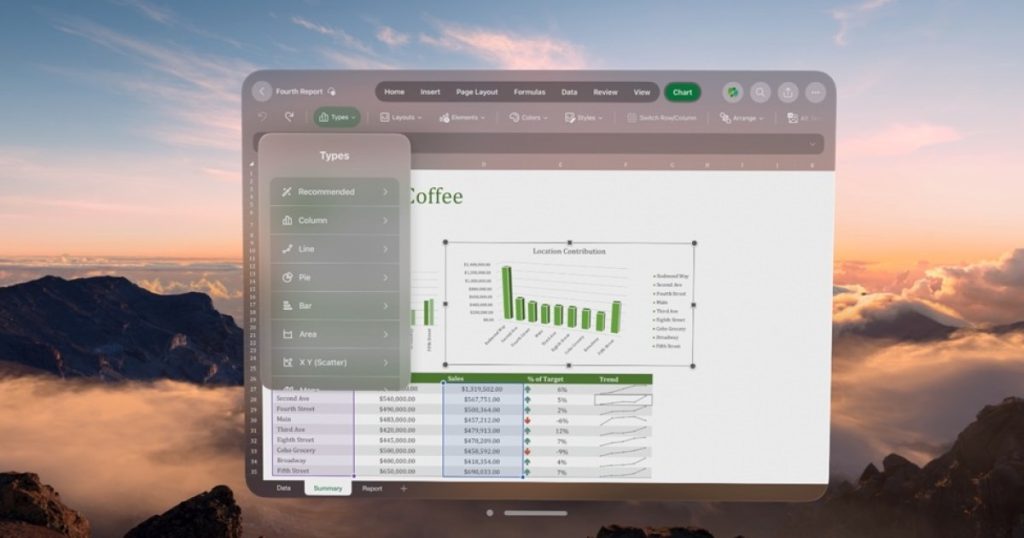
Workplace visualization tools play a crucial role in presentations and can add excitement to your meetings. Whether you have data to showcase or projections to share, a powerful spreadsheet is essential. You can choose between Google Sheets and Microsoft Excel, both excellent options for getting the job done. To determine which platform is best for you, consider various factors, and we’re here to provide you with the information you need.
We appreciate both Google Sheets and Excel for different reasons. Each software has its strengths and weaknesses, making it suitable for specific tasks. In this comparison, we focus on key categories like application access, data analysis, and charting capabilities.
The basics
Google Sheets and Microsoft Excel are both exceptional spreadsheet applications. Both offer user-friendly interfaces, similar navigation, and a range of tools for data management. While they share many similarities, the differences lie in the features and capabilities they provide.
Both applications offer functions, formulas, conditional formatting, and other basic tools. However, each excels in different areas, which we will explore in detail.
Application access
Google Sheets is a web-based application with a mobile version but lacks a desktop option. This offers accessibility across various devices, with workbooks automatically saved to Google Drive.
Microsoft Excel, on the other hand, is primarily a desktop application but also has mobile and web versions. Excel for the web provides cloud access, albeit with some limitations compared to the desktop version.
Data analysis
Both Google Sheets and Excel offer tools for automatic data analysis, sorting, filtering, and more. Excel provides advanced features like Goal Seek, Forecast sheets, pivot tables, pivot charts, and slicers for sophisticated data manipulation.

Excel’s additional data analysis capabilities give it an edge over Google Sheets, offering more robust tools for in-depth analysis and visualization.


